Mobile App Download Statistics & Usage Statistics (2026)
Comprehensive 2026 mobile app download and usage statistics: store-by-store downloads, time-spent data, category share, revenue, region splits, and the trend lines that matter for product and marketing planning. Includes the source for every number so you can verify and cite.
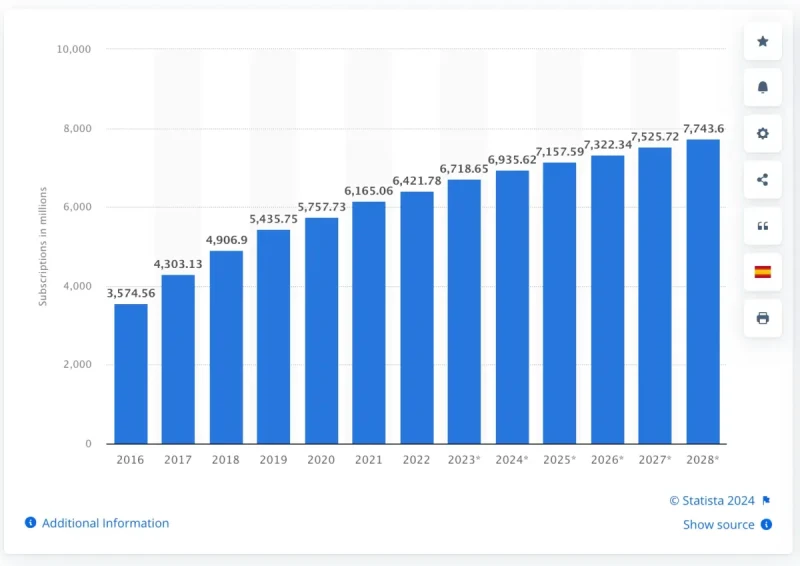
Let me share something wild with you. Right now, over 6.4 billion people have smartphones. That's almost everyone on the planet! And by 2028? We're looking at 7.7 billion. The numbers just keep climbing, and honestly, they show no signs of stopping.
If these numbers influence your roadmap: Swiftspeed Pro is $15/mo through the 50% off launch promo (forever-locked at signup) and ships 90+ live verticals including event ticketing, ewallet, loyalty, fitness, and an AI app builder.
Next time you're out, just look around. I bet you'll spot at least five people glued to their screens. We're all a bit addicted. Here's what really blows my mind - add the 1.14 billion tablet users to the mix (that's 36% more than in 2010), and you've got a massive audience just waiting for the next great app.
Fun fact: Americans check their phones 144 times a day on average. Sure, it's dropped a bit since 2021, but come on - 144 times! That's once every 10 minutes if you're awake for 16 hours.
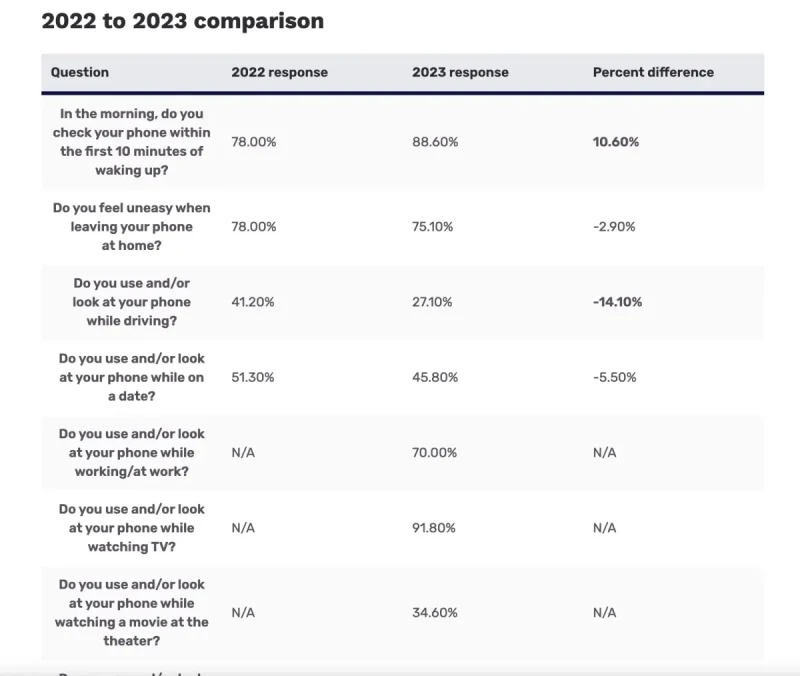
I'll be honest, we all check our phones everywhere. At work, in bed, while walking, during meals, even while driving (guilty as charged, but seriously, don't do this). You're probably reading this on your phone right now, aren't you? Here's how things changed between 2022 and 2023:
You have to wonder what people are doing with their mobile devices that have provoked this addiction. All research pointed to the fact that around 88% of mobile screen time is spent on apps, according to InsiderIntelligence, so they are moving from one app to another! That is it! We're basically app-hopping all day long.
This is good news for app creators, publishers, and even readers who intend to create an app. However, if you have ever considered mobile app development as a business, you should understand that, for one to amass long-term success in this niche, there are two things that need to happen:
- Users need to download the published apps.
- And users need to use the downloaded apps often.
These two simple facts are why I spent months putting together these statistics for you. Sure, everyone's using apps more than ever, but that's just the tip of the iceberg. You can't just jump into app development because it "feels right."
It's like saying, "Hey, people build houses, so I'll sell paint." But wait - what kind of paint? Interior? Exterior? Matte? Glossy? You need to know your market.
If you want to grab your slice of this multi-billion dollar pie, you need to understand WHY people download apps and HOW to build app people actually need and will use.
Use this research to build something amazing or make your existing app even better.
2026's Most Important Mobile App Statistics
- Apple App Store has 1.96 million apps ready to download
- Google Play Store beats that with 2.87 million apps
- 21% of Millennials open apps 50+ times daily (Gen Z? Don't even ask - it's way more 😉)
- Mobile apps will rake in over $522 billion by 2026
- 49% of people open apps 11+ times every day
- Americans spend 70% of their digital time in mobile apps
- Average person uses 10 apps daily, 30 monthly
Mobile App Usage ( In-Depth Insight)
Would you believe if I say that the average person spends 3 hours and 10 minutes on their phone daily. And 2 hours and 51 minutes of that? Pure app time. That's 90% of all phone use!
A 2019 research shows that most people have about 80 apps installed on their phones. But here's the kicker - they're not using most of them.
The reality? People use about 9 apps per day and 30 per month.
Quick math: If you've got 80 apps but only use 30 monthly, that means 62% of your apps are just sitting there, forgotten.
Even worse - 25% of downloaded apps get opened exactly once, then abandoned forever. We've all done it - download an app, open it, think "meh," and never touch it again.
Let's dig deeper into how people really use apps.
Mobile App Retention Insight
So you got someone to download your app. Great! But that doesn't mean they'll stick around. If you're a developer watching your download numbers but not making money, you're not alone. I see this problem all the time when I talk to app creators.
The best way to measure this? Look at retention and churn rates.
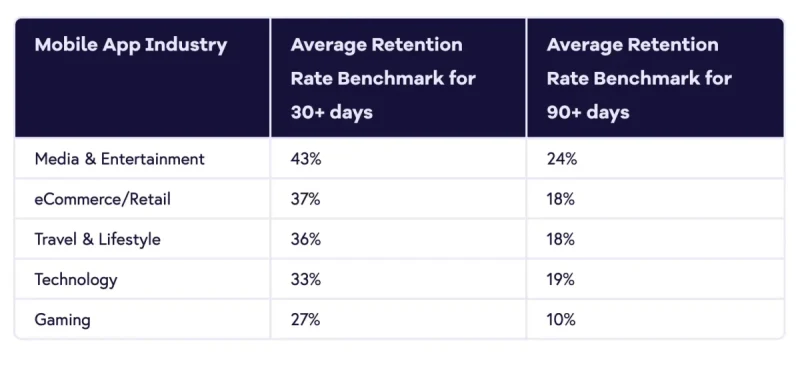
Here's the brutal reality: 71% of users abandon apps within 90 days of downloading them. The average 30-day retention rate? Just 42%. After 90 days? You're down to 25%.
Different industries see different numbers - anywhere from 27% to 43% for 30-day retention. The best apps might hit 66%, but again, that's rare.
First, track these numbers religiously. Second, give users a real reason to come back.
You'll never keep everyone - that's just how it goes. You'll always need fresh downloads. But don't ignore your current users while chasing new ones.
If your app crashes, glitches, or just sucks to use, people will bail fast. Even the biggest apps have bugs sometimes, but it's your job to fix them quickly. Keep improving, keep updating, and make the experience better with each version.
The Most Essential Mobile Apps
We've talked about what's available and what categories are popular. But which apps do people actually say they NEED?
So now I would like to show you the list of essential mobile apps that most smartphone owners claim they can’t do without.
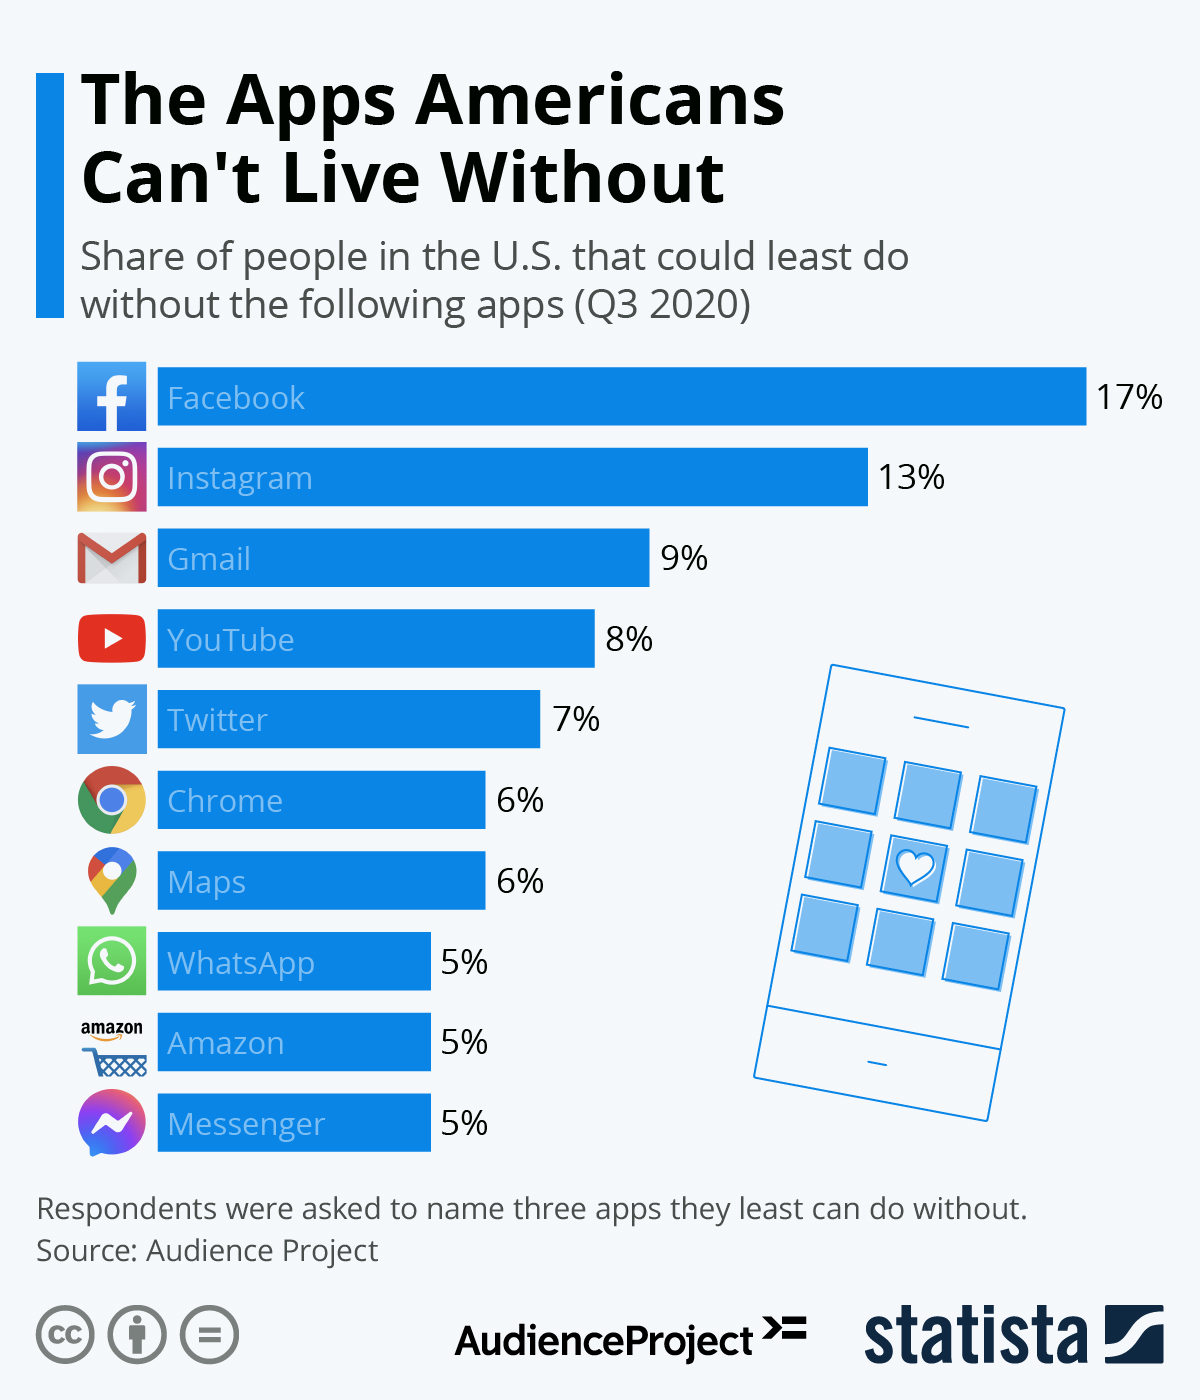
You will find more infographics at Statista
This list makes sense if you look at it. All the leading apps have their own specific purpose and can be used as a part of one’s daily routine.
- For social media, Facebook and Instagram.
- Gmail for email communication
- YouTube for video content
- Maps for navigation
- Amazon for online purchases
- Messenger and WhatsApp for instant messaging.
- Chrome for browsing the Internet
- Personally, I cannot recommend creating an app that is competitive with one of these top apps to those who would like to create a mobile application.
Nothing wrong with dreaming big. You can absolutely build a successful shopping app for your business. But trying to be the next Amazon? That's a tough mountain to climb.
Can you make a GPS app? Sure. Will it beat Google Maps? Probably not (but hey, I'm not God - prove me wrong!).
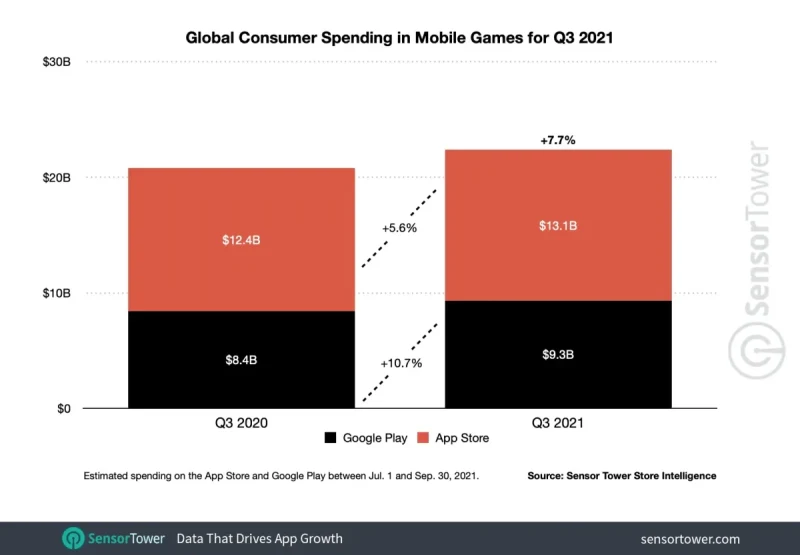
Apple iPhone and Google Android Global Spending
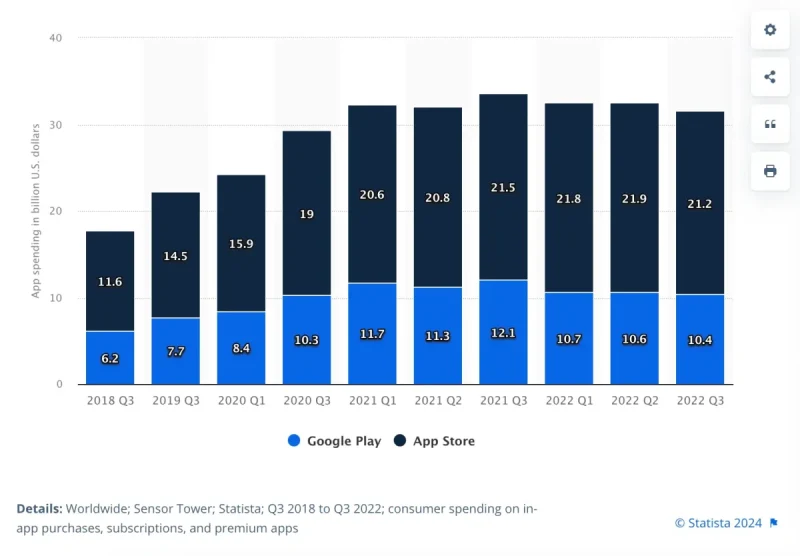
iOS and Android users are different breeds. They download differently, use apps differently, and most importantly - they spend differently.
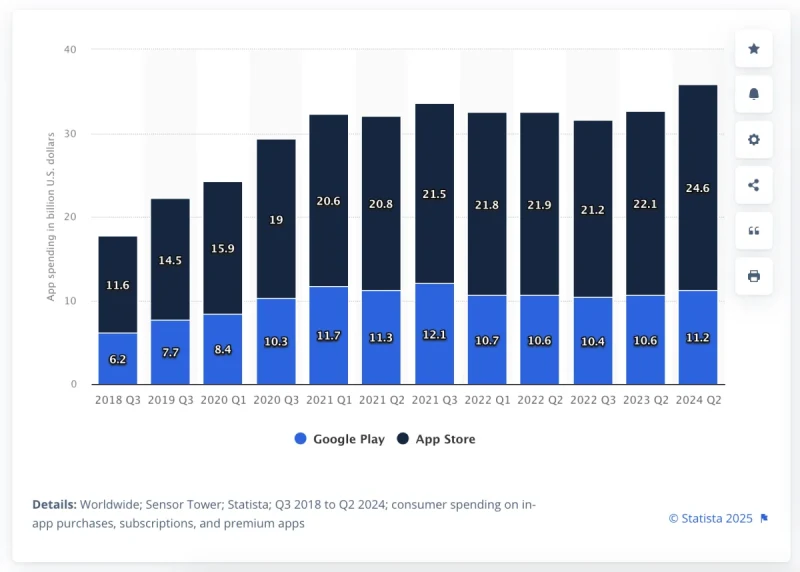
First, let’s focus on the consumers’ spending behavior on their devices. Here’s the latest data from Q2 2024:
- Google Play Store Gross App Revenue: $11.2 billion
- Apple App Store Gross App Revenue: $24.6 billion
These numbers include paid downloads, subscriptions, and in-app purchases.
Even though Android has more users worldwide, Apple users spend about twice as much. Wild, right?
Your app should work for everyone, but if you're looking to make money from premium features or in-app purchases, iOS users are more likely to open their wallets. Not throwing shade at Android users - just sharing what the numbers say.
Mobile App Usage by Age
According to Simform, Gen Z (younger adults) spends more time on apps than Millenials (older adults)
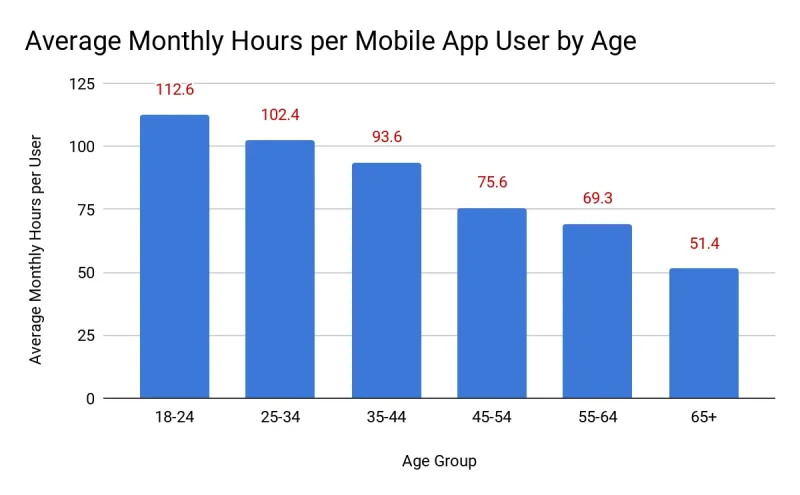
No surprise there - younger folks live on their phones. But don't write off older users!
People aged 45-54 spend about an hour and 15 minutes daily in apps. That's only 27 minutes less than 25-34 year olds.
Even folks 65 and older spend nearly an hour per day in apps.
Build Android and iOS Apps with Swiftspeed
Want to build an app without coding? Swiftspeed makes it easy. Create professional apps for your website or business - no programming required.
Mobile App Usage by Device
Mobile habits vary in ways that span beyond one’s ability to access mobile applications. Apart from the differences between the operating systems, the applications will also vary on the basis of the kinds of mobile devices that people use.
Smartphone App Usage Statistics
People have smartphones, tablets, personal computers, and laptops. You can even connect to content and apps from smart TVs, watches, smart home devices, and smart cars.
However, there are some categories where smartphone app usage fully prevails. These are the leading areas in which people tend to use their smartphones:
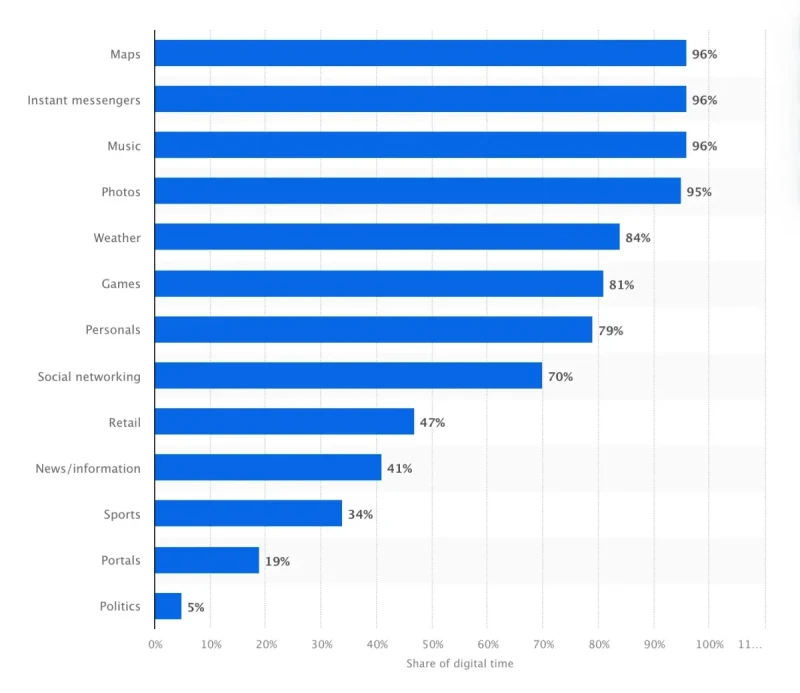
96% of the digital time spent on maps in the United States came from smartphones. 86% of digital weather information was consumed via smartphone apps too.
When one goes out and about, it is clear that a smartphone is the best option for traveling and using maps and GPS services since they are inseparable.
However, if you scroll down this list a bit more, you will notice other categories that are not as apparent.
For instance, 47% of retail consumption is from smartphone apps. Despite all the avenues available for online shopping, the number of people who use smartphones remains high.
Another category that catches my eye is news and information. Although smartphone usage is just more than 40%, it is significant compared to other platforms and outlets. Let's asses Mobile Phone Vs Tablet
Mobile Phone vs. tablets
There are a number of differences between smartphones and tablets also
If you recall, earlier, I mentioned that the number of smartphones in the world today is two times more than the number of tablets (2.7 billion versus 1.35 billion). However, table usage is showing signs of matching smartphones.
Individuals download more apps on their smartphones and use more smartphone applications on a monthly basis. As shown in the picture, however, tablets are not that much behind.
Looking at the fact that smartphones are almost always just an arm’s length away, it is only logical that they will be used more.
Nevertheless, tablets slightly win over smartphones in the segment of paid apps or subscription purchases made through the app. This could be a category that the tablets will always lead in future years.
Mobile App Usage Statistics by Country
As is with most things, behavior adapts to and differs because of the type of place one is in. This same idea can be applicable to app usage.
We will analyze it and see what kind of mobile application, in which regions of the world, can be used. With this kind of information, you could learn about the target audience or even get an insight into the new markets as a potential opportunity for your promotional campaign.
App Downloads by Country
In China, in the last four years, the prevalence of app downloads has increased by 80% per statista.
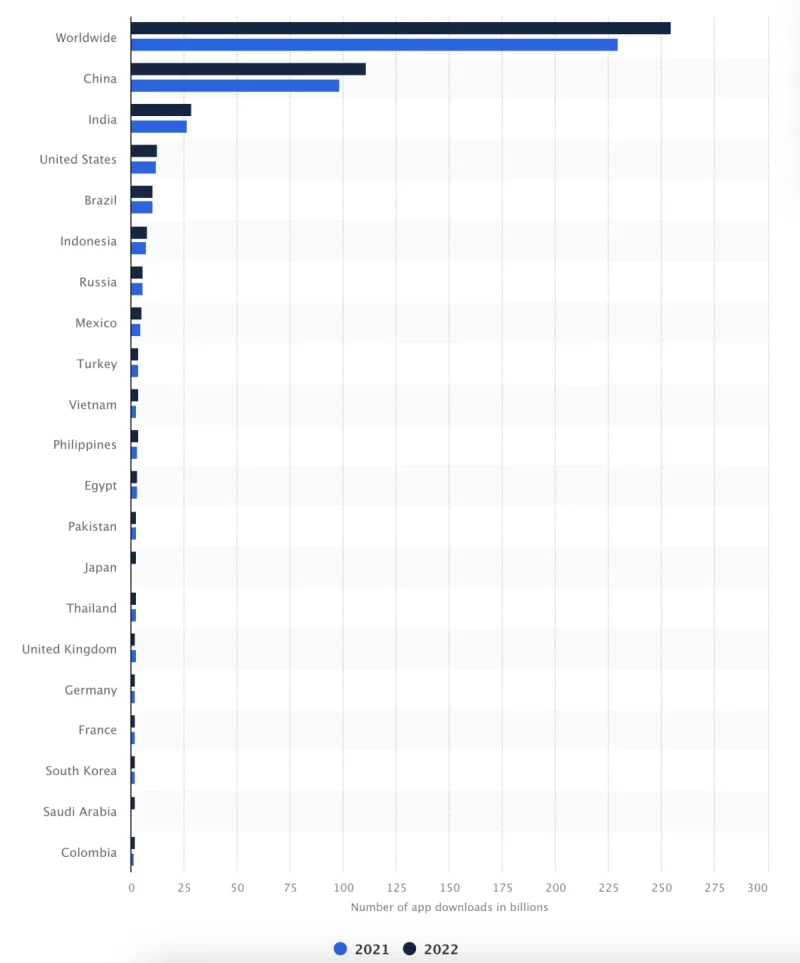
However, other developing countries such as India, Indonesia, and Brazil have all posted impressive growth in their economies. This can be clearly seen from the above graph, as India’s rate of growth for app downloads over the same period is a staggering 190%.
In other representations, with the development of technology and higher accessibility rates of the same among emerging market consumers located around the world, targeting international consumers with an app is still an attractive solution for certain business categories.
👉🏾 Other Swiftspeed users also read: Complete list of top mobile app stores in 2026
Monthly App Usage Statistics
If you look at the amount of time people spend using mobile apps in various countries around the world, you will be shocked, just as I was.
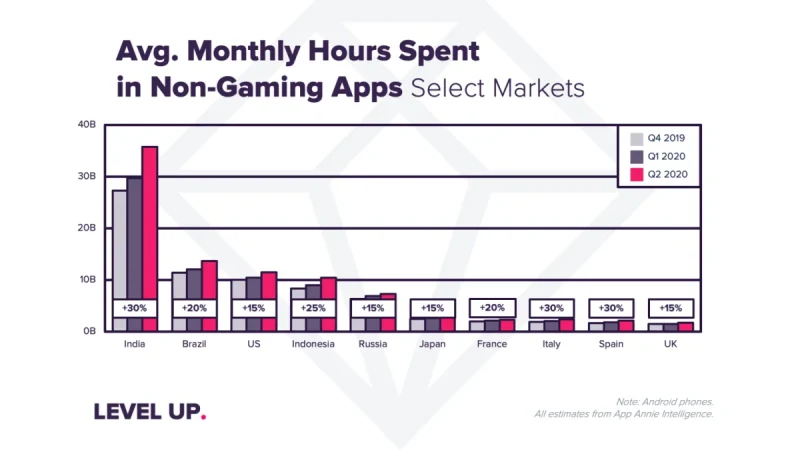
From many standpoints, this graph reflects great similarities to the previous graphs we have seen before. With more and more downloads in India, it is only logical that the users would also spend some sort of time using such apps.
There is one thing, however, which holds true for all these notions. The time mobile apps take is developing yearly, for instance, in a country like Italy, which has a minimum population compared to India. However, both these markets also exhibited an average of 30% spent time using apps from 2019-2020.
App Store vs. Google Play (iOS vs. Android) Downloads Stats
The global market share is mainly dominated by Android. That’s why, it’s not surprising that the lion’s share of app downloads in the whole world takes place through the Google Play Store.
Interesting data is that Apple wins hands down vs. Google Play worldwide downloads. Do not take my word for it; read this comprehensive report by Sensor Tower.
Looking at the chart below, you can see that we are at about an equal 50-50 ratio in America. Google Play Store dominates every other part of the world, but in Japan, however, Apple App Store downloads have a strong claim.
Now, Let us access Download Statistics
Mobile App Downloads
If you build an app and you have no users or downloads, how do you become successful as a developer?
This may seem to be a straightforward question; as a developer, You may often find yourself guilty of neglecting this fact. Even if you have the most horrendous app in the universe and people continue downloading it, you will keep making money.
Therefore, before you even start getting people to download your app, you need first to invest enough time in conducting in-depth research. Here I present the most important mobile app download statistics for 2026 that will help you get off the ground.
Global App Downloads Statistics
People in nearly all parts of the earth have resorted to using smartphones and tablets.
The tendency to download mobile applications is also growing in popularity from country to country due to mobile app use.
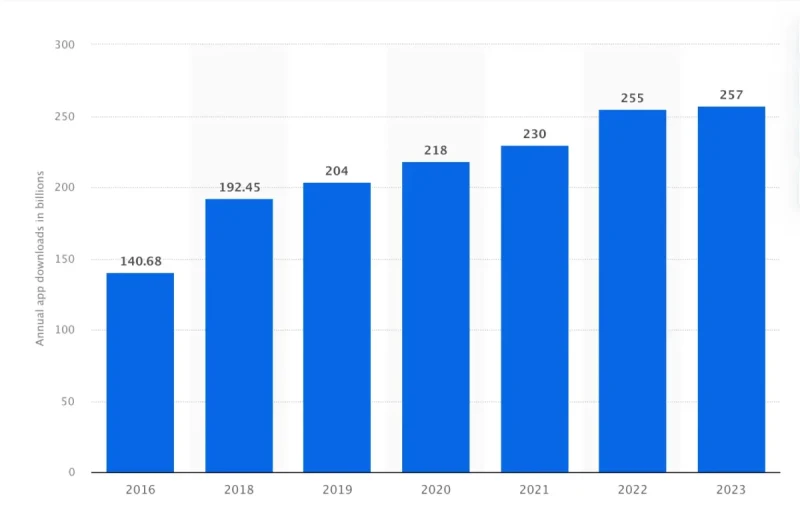
App downloads are growing every year. This tendency will also continue in the next years.
In the previous year, there were more than 218 billion app downloads. This is about a 7% growth from the previous year.
From the figure above, there was a 55% increase between 2016 and 2020. The annual growth rate is not as steep, but it is still going up.
Free vs. Paid App Downloads Statics
First, when you’re developing a mobile app, one of the most important decisions is your app monetization strategy.
You are building an app for that reason, aren’t you?
You may have even considered the idea of charging people for downloading apps. However, will people download your app and pay for it?
Let’s consider the difference between free and paid apps. Almost all of the world's downloads are totally free.
In reality, over 98% of mobile app revenue throughout the world is generated from free apps. Only a few individuals are ready to purchase downloads.
I am not saying you should never consider the possibility of a paid app. Both approaches are beneficial in terms of the kind of app that you have.
Initially, if you charge for downloads, fewer mobile users will download the app. This is because most people are used to being given free downloads.
Just consider your personal mobile device. Are there any apps that you have paid to install? You are in the minority if you do so.
On the other hand, those who download paid apps tend to be more engaged. They are not going to buy something and then leave it idle.
However, downloads do not have to be charged to earn money from your app.
If you already own a business and have an app that acts as a supplement to that business for the purpose of improving the customer experience, then yes, you should be giving away free downloads.
Mobile app users are not supposed to pay for their downloads. This is due to the fact that the majority of apps on the Apple App Store and Google Play Store are given free of charge.
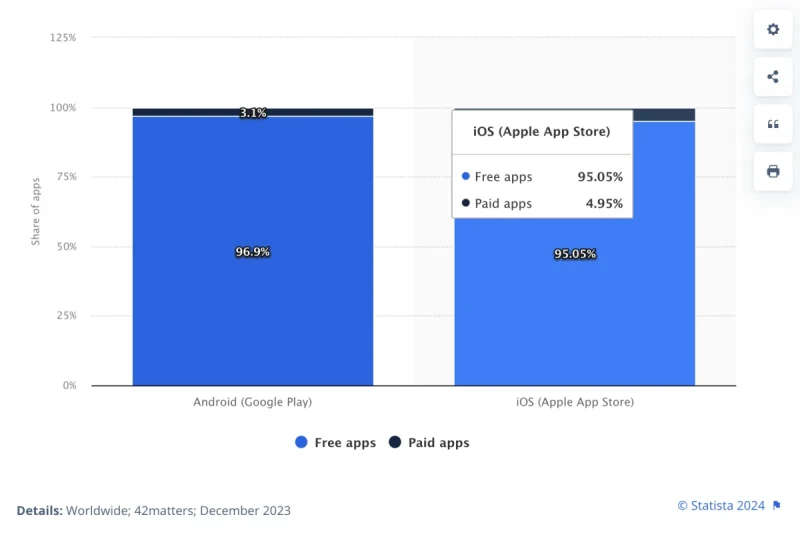
The above graph is made from a study done by Statista as of the month of December 2023.
Free apps can be used as a pre-IPO startup for a new app idea. Even if you introduce your app as a free app, you can still generate revenue if you offer it for free. There are numerous other monetization options, including in-app purchases.
If your app is an ecommerce tool, check out the latest mobile commerce revenue and usage statistics.
Google Play vs. App Store Downloads
Most mobile users are downloading apps from two locations, and without mentioning, you can already tell it's almighty Google Play and the App Stores, even though there are other App store alternatives.
Compare these two platforms in terms of global app downloads:
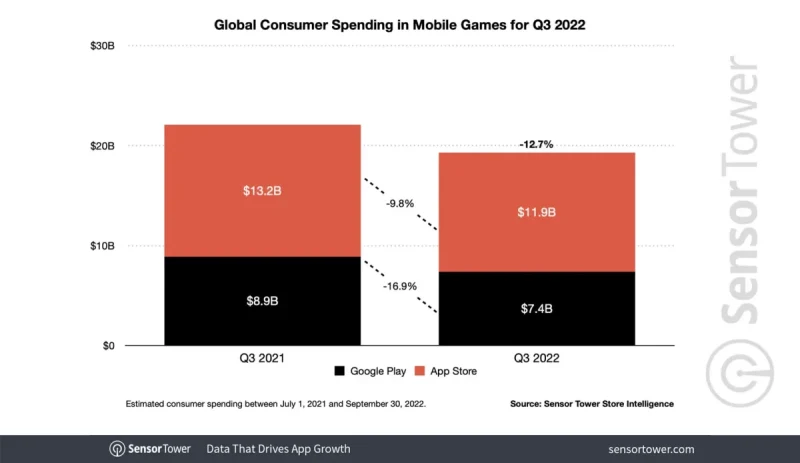
Globally, there are more downloads that originate from the Google Play Store. However, as it is evident from the graph above, the percentage of downloads decreased in both stores from 2021 to 2022, and that's understandable as the world was just getting out of the pandemic; in the previous year of 2020 and 2021, you will notice a massive increase in downloads across both stores.
The growth rate for Google Play Store downloads was 31%, whereas Apple App Store had a growth of 2.5%.
Briefly, the Google Play Store downloads are higher and it is growing faster.
These trends are likely to prevail in 2026
Build Android and iOS Apps with Swiftspeed
Create premium apps without writing a single line of code, thanks to our user-friendly app builder. Build an app for your website or business with ease.
r
Apple App Store Download Statistics
To begin with, we’ve already compared the two app stores as to how they differ. However, now it’s time to drill down these figures even more and deepen the analysis of each app ecosystem.
First, we turn to the Apple App Store download total.
Most Prevalent App Store Categories
For your business app to be successful, you need to know what the consumers are looking for. This is more so for a new application.
Your app may be revolutionary in terms of software or the concept behind it, but if there’s no market for its usage, then you will have severe trouble getting downloads.
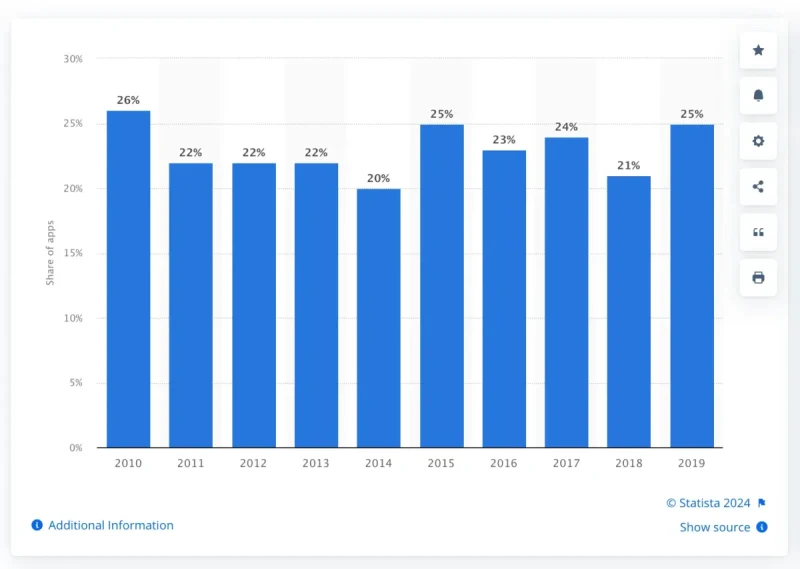
To start with, you should know which category of apps is downloaded more frequently. The following categories are the most popular ones on the Apple App Store according to their percentage availability.
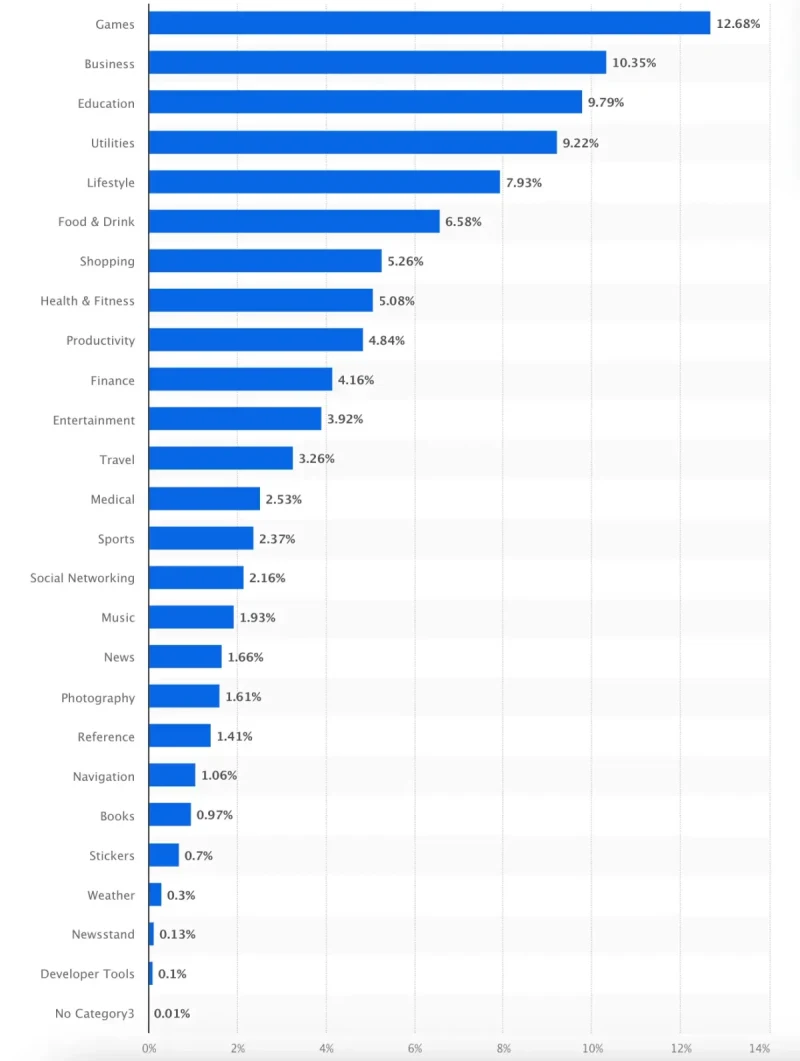
However, unless you are planning to develop a new app from zero, you will most probably not build a game app. For instance, if you have an online shop. Your business app should not include a gaming section in your app just to be classified in a more popular category.
Depending on the purpose and functionalities of your app, your app category has to be appropriate; if you miscategorize your app features, It is most likely that your app submission will be rejected. If you are a business or lifestyle application owner, you cannot classify your application as a game in an attempt to have an increased number of downloads.
In reality, if you do not specify the category pertaining to your app’s main purpose, you violate the App Store review guidelines.
Failure to comply with these conditions could have your app deleted from the App Store. Of course, no one will be able to download your app if this happens.
Therefore do not try to cheat the system. Your app can still be a great success if it is not in one of the leading categories. If you have the necessary market strategies, you may be able to focus on a less crowded niche category and dominate a greater proportion of a smaller market.
Apple App Store Availability
As I have already said, the mobile app business is very competitive.
However, how many of such apps are going to be competing? Check the number of apps on the Apple App Store.
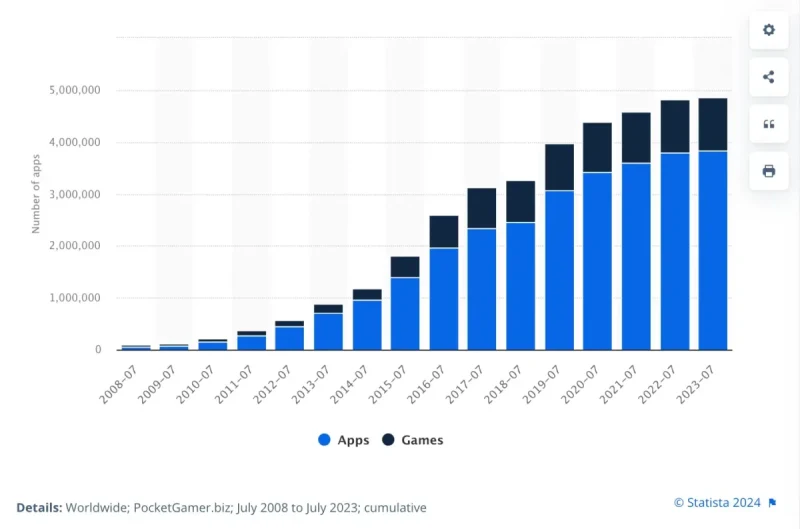
The number of apps available in a given year is increasing with each passing year, as seen in the image above; if you are building an app as of 2026, you will be competing with almost 4 million existing apps on the Apple app store alone.
All figures above point in an upward direction, and the trajectory is clear. Every individual has a mobile device these days, and the downloading of apps is at a record high. Therefore, it is logical to note that more apps are directed to the market.
So, is the increase in downloads because more apps are there? Or is it because so many other apps have been released that there are all these different apps?
It is difficult to say, but it can be argued either way. This will be clearer once we analyze the Google Play Store.
Google Play Store Download Statistics
Next, we are going to see the download counts of Android devices.
I did a comprehensive research and came up with a detailed analysis of the Google Play Store.
Google Play Store Availability
We have concluded the discussion of the availability of the Apple App Store. I would like to start by giving you a quick look at the total number of apps available to download from the Google Play Store as of December 2023.
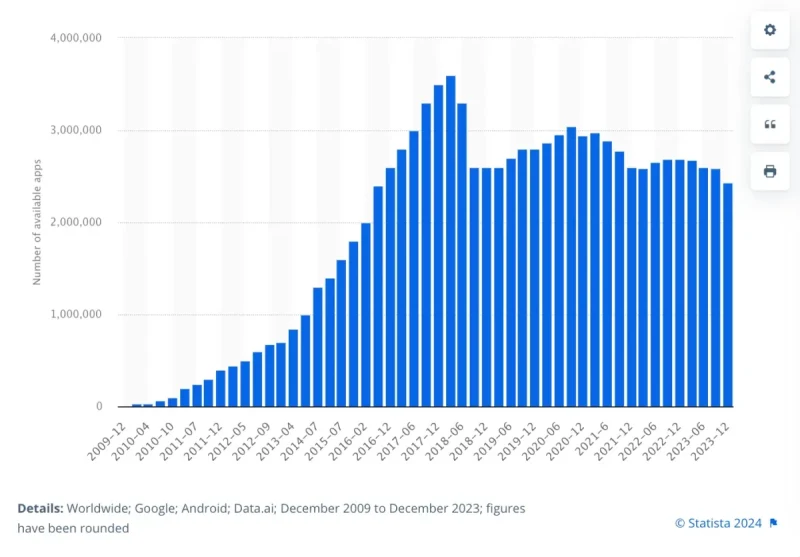
From the given graph, it is clear that this category does not portray the same trend line as Apple for the same category. As a matter of fact, we had a downward trend post-mid-2017 and fell even harder in 2018. This number of apps has been increasing steadily since then until it fell again in 2021.
Why is this happening?
There is intense competition in the Google Play Store. Certain apps just could not make it through.
I am not inclined to imagine any more downward trend. Given the trend line from 2009 to 2023’ worth of information presented above, it is logical to conclude that the trend will continue for a long time.
As we have already noticed, the data for Google Play Store downloads kept growing despite the fact that there had been a decrease in the number of apps available to be downloaded during this same period.
Let’s link this with Apple. While the number of Apple App Store apps that are available is growing each year, the percentage of download growth rate has been lower in comparison to Android’s Google Play Store. Nevertheless, based on the above information, I think it’s safe to say that the number of apps in each store does not correlate with the increase in app downloads at large.
Google Play Store Most Popular App Categories
Penetration can be used to measure the success of an app category. As demonstrated by Statista, these app categories have the highest penetration rate among Android users. Let's take a look at the top 30 categories as an example
| Category | Percentage |
|---|---|
| Tools | 99.81% |
| Communication | 99.93% |
| Business Apps | 99.33% |
| Video Players & Edit | 96.63% |
| Travel & Local | 95.70% |
| Social Media Apps | 95.02% |
| Productivity | 91.67% |
| Music & Audio | 88.38% |
| Entertainment | 83.85% |
| News & Magazines | 81.11% |
| Photography | 75.77% |
| Books & Reference | 70.74% |
| Lifestyle | 65.67% |
| Personalization | 61.62% |
| Games (Casual) | 58.86% |
| Games (Puzzle) | 56.50% |
| Games (Arcade) | 55.08% |
| Shopping | 35.79% |
| Games (Action) | 34.19% |
| Weather | 32.46% |
| Games (Racing) | 30.83% |
| Sports | 30.44% |
| Education | 29.28% |
| Finance | 25.75% |
| Health & Fitness | 23.17% |
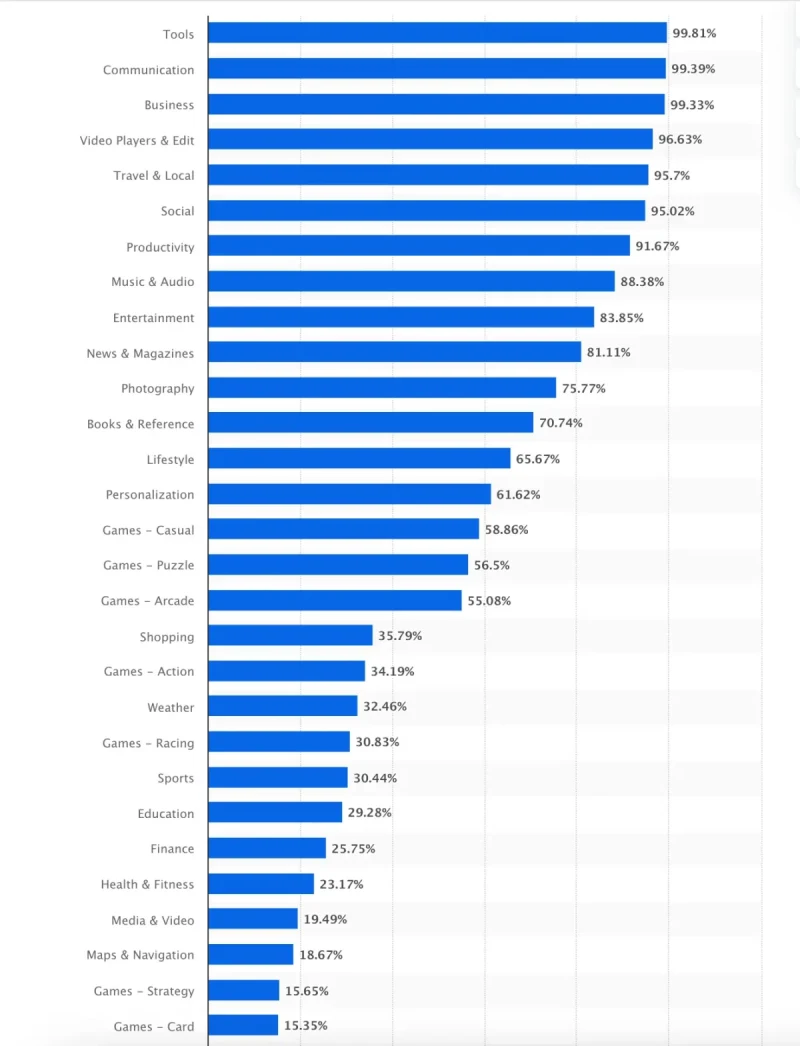
However, some of these categories that are designed for leading Android apps should be taken with a pinch of salt. For instance, consider the main groups on the list. Those apps (communicative apps, for instance) are probably installed on all Android devices by default by manufacturers.
However, apart from that, this list provides a clue as to the categories of downloaded apps by Android users (applications like WhatsApp, Snapchat, Netflix, TikTok, Spotify, and Tinder). Yet, simply because an application has been downloaded to a device, this doesn’t suggest that it is in use. We discussed this notion in detail earlier when we were talking about mobile app usage statistics.
Mobile App Revenue Statistics
One of the most dynamically growing and, as some may say, the most obvious factor of proliferation in the digital economy is the app economy, powered by technological breakthroughs and changing consumer behaviors.
In this section, we will drive in-depth Mobile App Revenue statistics; this is actually my final straw to convince you why you need to build a mobile app.
Forecasted Global App Revenue
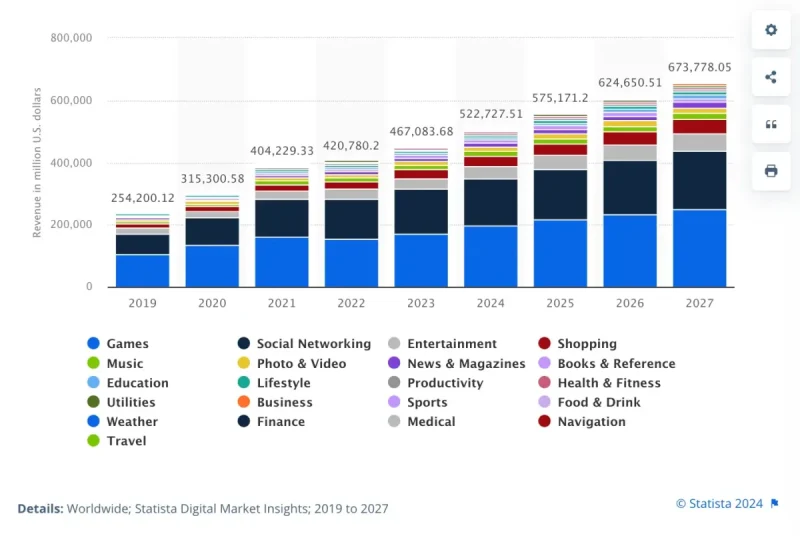
According to Statista, mobile app revenue worldwide in 2026 is projected to be more than $522 billion as compared to about $404 billion in 2021. This shows an outstanding CAGR (Compound Annual Growth Rate) of 29.21%, indicating that this market has high growth prospects.

Revenue Breakdown by App Category
The domination of gaming applications continues; Newzoo forecast a global mobile gaming revenue of $117.8 billion in 2023. Besides gaming apps, there is an impressive trend among non-gaming apps led by categories such as Entertainment and Lifestyle boosted with subscription-based monetization.
The Asia-Pacific region is expected to grow largely on the back of emerging markets such as India and Indonesia and contribute significantly to the global app revenue. Smartphone penetration and consumer purchasing power have remained strong in the North American and European regions, allowing them to continue to contribute to overall revenue generation processes.
👉🏾 Other Swiftspeed users also read: How do Free Apps Make Money in 2026? strategies Exposed
It is projected that the majority of revenue will come from in-app advertising and the freemium model. Nevertheless, paid downloads are also projected to grow their role due to consumer willingness to pay for distinct, high-quality content.
The transformative possibilities of the global app market continue to come into sharper focus. With the changes in app usage behaviours and the rapid development of global digital transformation, app revenue performance is also expected to soar. By 2026, stakeholders in the app market will be required to position themselves strategically to take advantage of the clear opportunities presented.
Wrapping Up
Mobile applications have become an integral part of our daily routines, and the trend does not seem to stop in 2026. Indeed, the year is set to be another monumental one for the mobile app industry.
While mobile usage and market penetration are currently at their peak, all the data analyzed suggests the only way from here is up; if you are considering app development, yesterday was the best time to start, and the next best time is now.
This upward trend bodes well for anyone who owns a mobile app or plans on creating one. However, successful app development and management require staying abreast of the latest research and industry trends.
Consider this guide your go-to resource for understanding; this is a guide that is regularly updated every quarter. to ensure information in the mobile app industry regarding downloads, usage, and revenue are up to date.
If 2026 is the year you have chosen to develop an app, Swiftspeed is ready to help facilitate your journey. Our app builder platform allows the simultaneous creation of iOS and Android apps without you needing to write a single code.
What key performance indicators are you using to track your mobile app's usage statistics?