App Analytics
S
Swiftspeed TeamWhat App Analytics Tracks
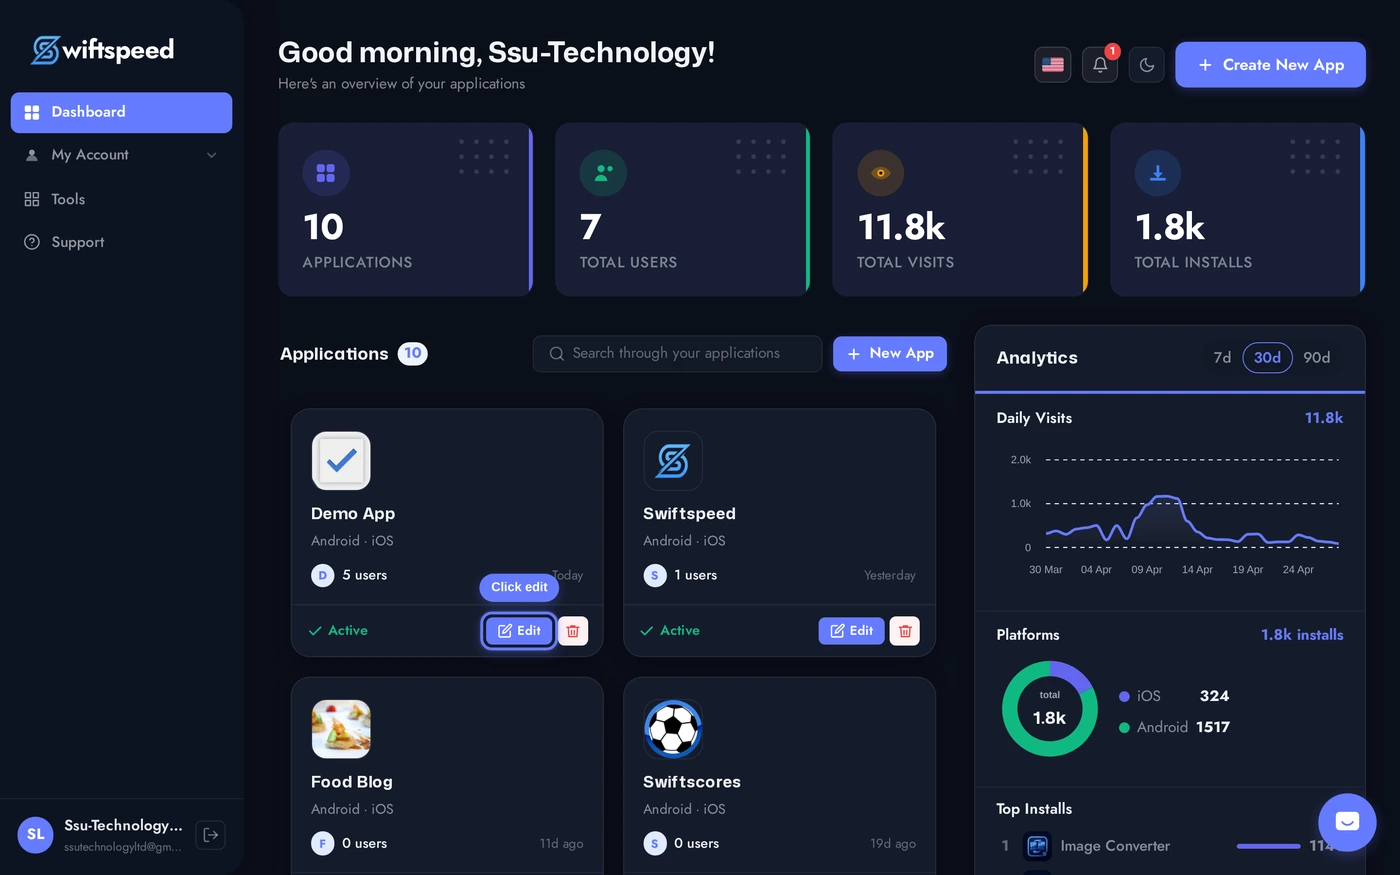
The App Analytics page in the sidebar shows a complete picture of how your app is performing. The metrics are collected automatically by every Swiftspeed-built app, no SDK to wire up, no Firebase / Mixpanel / Amplitude account required.
- Installs: new installations per day, total all-time.
- Sessions: number of times users opened the app per day.
- Screen views: which features users open most.
- Active users: daily / weekly / monthly active user counts.
- Engagement: average session length, screens per session, return rate.
- Push performance: open rates per push notification you sent.
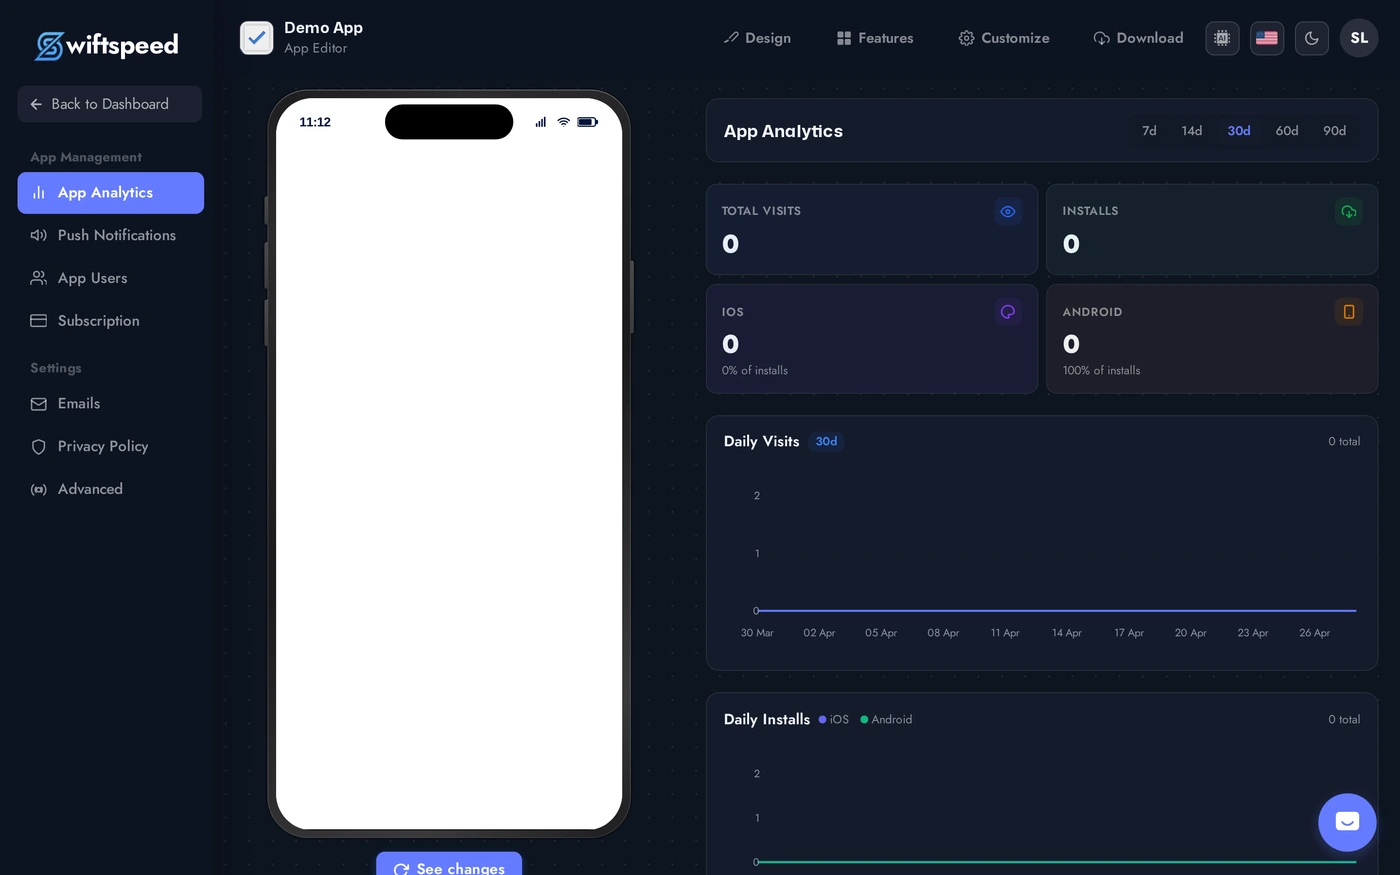
Where It Lives
Open the app in the editor.
Sidebar > App Analytics. The page shows stat cards at the top (installs, sessions, active users, engagement) and time-series charts below. Date-range picker switches between 7d, 14d, 30d, 60d, 90d.
Reading the Metrics
- Installs: the most-watched number, but a vanity metric on its own. Useful as a denominator for everything else.
- Daily Active Users (DAU) / Monthly Active Users (MAU) ratio: a measure of stickiness. 20%+ is excellent for most apps, below 5% means most installers never return.
- Session length: how long users stay. Long is good for content apps (news, audio, video); for utility apps (forms, contact, weather) short sessions are normal and fine.
- Screen views per session: high count means users are exploring; low count means they open the app for one specific thing and leave.
- Push open rate: percentage of push notifications that get tapped. 5-15% is normal; above 25% means your push copy is excellent.
Common Patterns and What They Mean
- High installs + low DAU: marketing is working but onboarding is not. Users install, see the first screen, abandon. Improve the first 60 seconds.
- Steady DAU + falling MAU: existing users stay, but new users churn. Look at retention curves; the drop usually happens between day 7 and day 30.
- High sessions + low session length: customers come back often but only briefly. Could be intentional (utility apps) or a sign of incomplete value (they want more but cannot find it).
- Push open rate dropping: your audience is fatiguing. Reduce push frequency or refresh the copy.
Tips
- Compare time periods, not absolute numbers. "Sessions up 30% vs last 14d" is the metric. Total sessions in isolation tell you nothing.
- Watch the cohort. A daily-installer cohort that retains 60% on day 7 vs 30% on day 7 in the next month signals a recent change broke retention. Find what changed.
- Push performance teaches you what your audience wants. A push that gets 25% opens is the topic to expand on. A push that gets 3% is one you should stop sending.
- Combine with App Store / Play Store analytics. Swiftspeed tracks in-app behavior; the stores track installs by source, demographics, retention curves. Both together give you the full picture.
- Privacy-friendly by default. No personal data leaves the device for analytics. Compatible with App Tracking Transparency on iOS and Play Store data safety form.