See how your app is really doing
Every Swiftspeed app comes with a built-in analytics dashboard.
Track installs, visits, sessions, and feature usage across iOS, Android, and PWA.
Every metric that matters, at a glance
Your Swiftspeed analytics dashboard gives you instant visibility into how your mobile app is performing across every dimension.
Track every time a user opens your app.
New app installations tracked daily.
Page-level interactions within your app.
Monitor churn and retention rates.
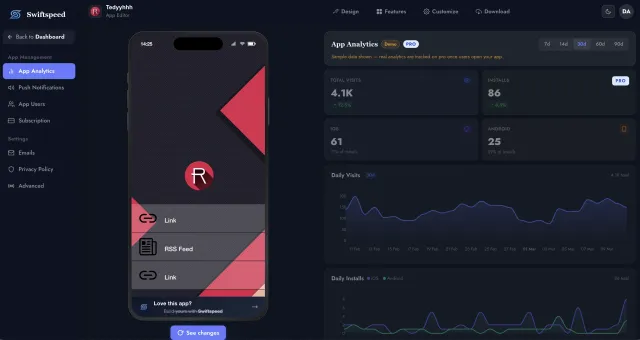
Your app's performance, all in one place
Open the Analytics tab and everything is right there. Daily visits, installs, which platform your users prefer, how long they stay, and which features they use the most. No setup, no waiting.
Understand your users. Grow your app.
Swiftspeed analytics captures everything you need to make data-driven decisions about your app.
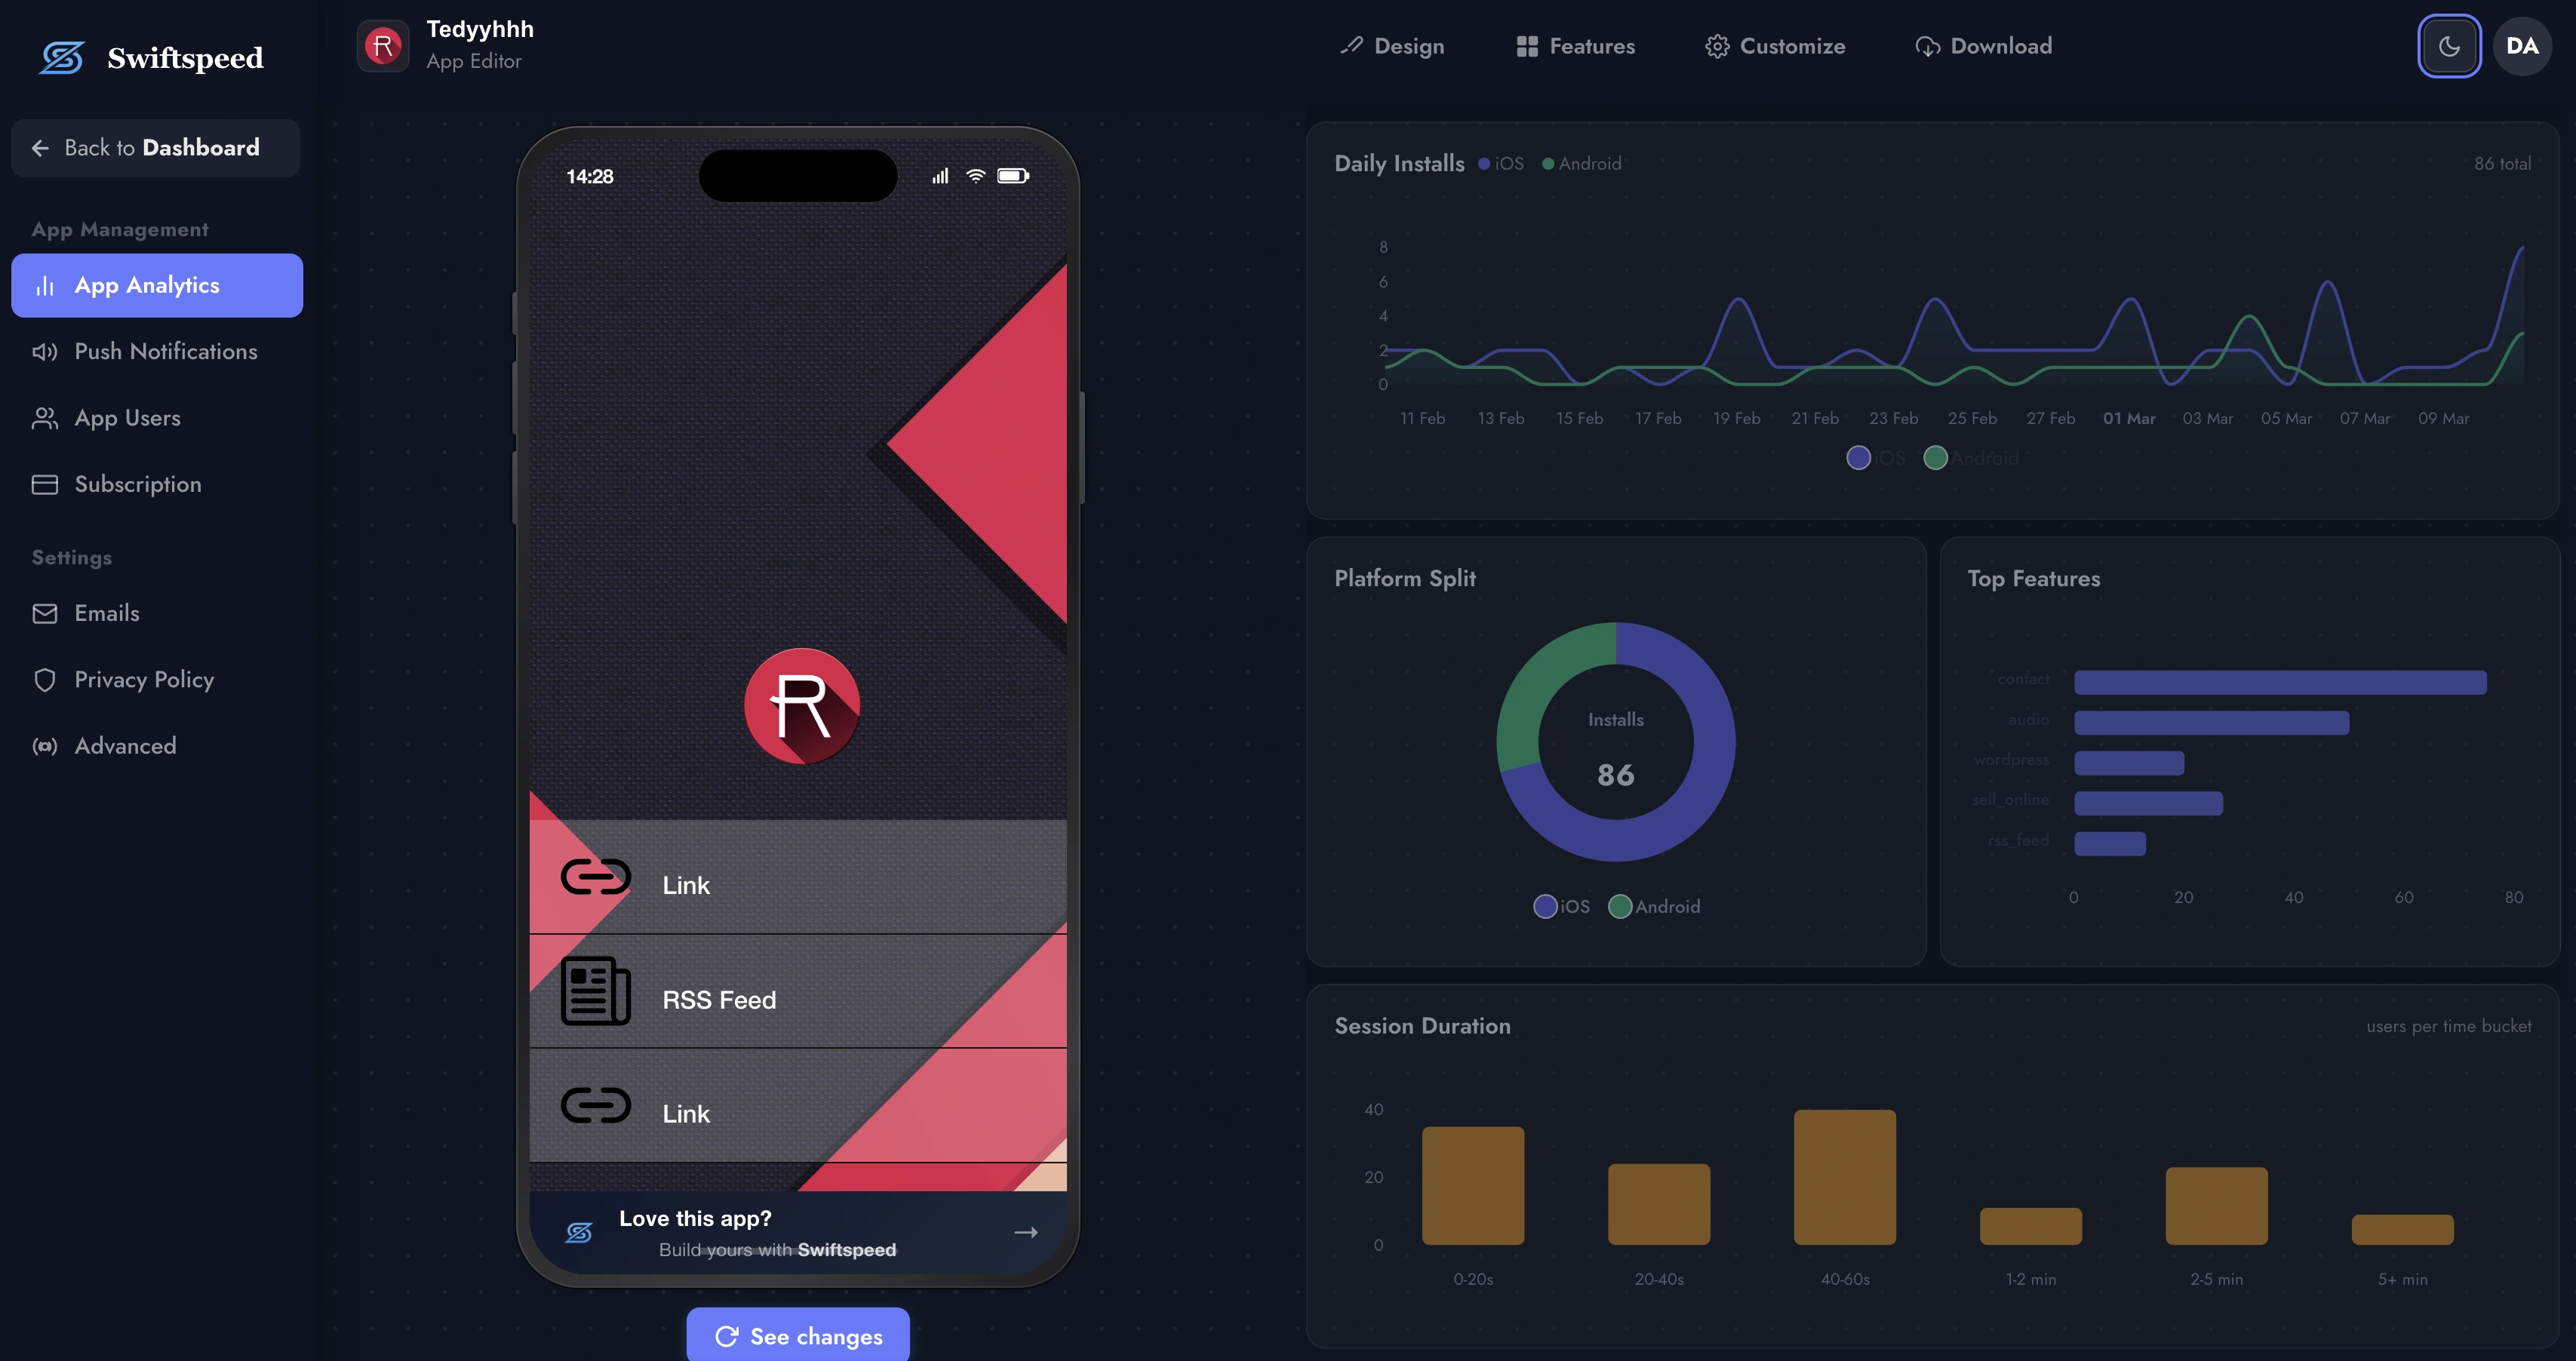
Daily Visits and Installs
Interactive line charts show your app's daily visits and install trends over any date range. Filter by 1 day, 1 week, 1 month, or full history. Spot growth spikes and seasonal patterns instantly.
Platform Split
See the iOS vs. Android vs. PWA breakdown with a donut chart. Know which platform drives the most engagement so you can prioritize your marketing.
Session Duration
Bar charts show how long users stay in your app. Measure average session time and track whether engagement is improving over time.
Top Features
Horizontal bar chart ranking which features your users interact with most. Know what drives engagement and what to promote.
Real-Time Overview Cards
At the top of your dashboard, four stat cards give you an instant snapshot: total visits, total installs, active users, and unique sessions. Each card updates as new data comes in, with color-coded badges showing trends compared to previous periods.
Analytics that work out of the box
No SDK integration. No code snippets. No third-party accounts. Analytics are built into every Swiftspeed app from the moment you create it.
Create your app
Sign up and build your app using the visual editor. Analytics tracking is automatically embedded in every app you create.
Publish and launch
Publish your app to the App Store, Google Play, or as a PWA. The analytics engine starts collecting data from the first user session.
Monitor your dashboard
Open the App Analytics tab in your editor. View visits, installs, platform split, top features, and session duration in real time.
Optimize and grow
Use the data to improve your app. Double down on popular features, fix drop-off points, and track how changes impact engagement.
Why app builders choose Swiftspeed analytics
Most no-code app builders either have no analytics or charge extra for them. Swiftspeed includes a full analytics suite in every plan.
Zero Setup Required
Analytics are built into the Swiftspeed platform. No Firebase, no Mixpanel, no code snippets. Create an app and your dashboard is ready immediately.
Cross-Platform Tracking
One dashboard for iOS, Android, and PWA. See how each platform performs side by side with the platform split donut chart and unified metrics.
Feature Usage Insights
Know which features your users love most. The top features chart shows you exactly where engagement is concentrated so you can make informed decisions.
Privacy-First Design
Swiftspeed analytics track aggregate metrics, not individual user behavior. No cookies, no personal data collection, fully compliant with GDPR and App Store privacy requirements.
Date Range Filtering
Switch between 1-day, 1-week, 1-month, and all-time views. Compare performance across periods to understand growth trends and seasonal patterns.
Included in Every Plan
Unlike competitors that charge extra for analytics or limit it to premium tiers, Swiftspeed includes full analytics in every plan, including the free tier.
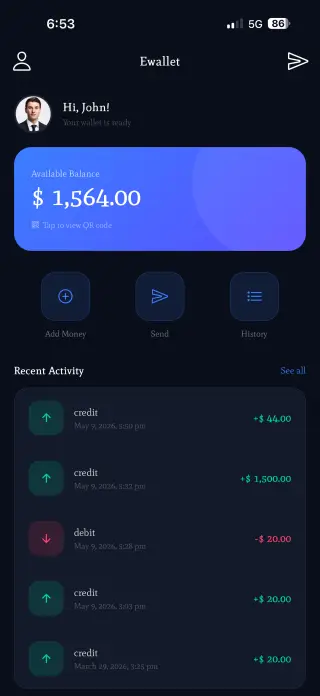
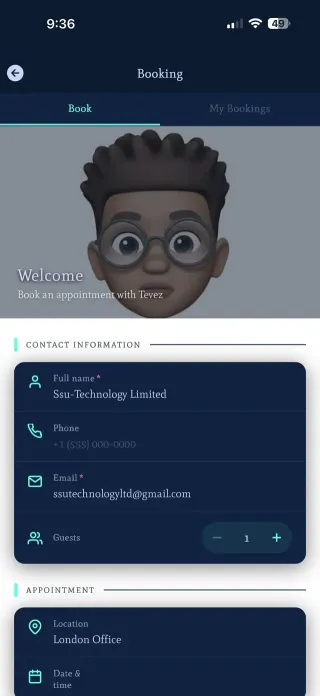
Real apps, real analytics
Every app you build on Swiftspeed gets analytics from the moment it launches. Here are some of the apps our users have built.


Frequently asked questions about app analytics
Ready to understand your app users?
Build your app with Swiftspeed and get built-in analytics from day one. Track installs, visits, sessions, and engagement across iOS, Android, and PWA.